 Economic activity in the non-profit sector totalled $169.2 billion in 2017, representing 8.5% of Canada's gross domestic product (GDP). Community non-profit institutions accounted for 16.4% of the overall sector, while business non-profit institutions accounted for 10.4%. The most significant portion of non-profit activity (73.2%) came from government non-profit institutions, such as hospitals and universities.
If included, volunteer activities—which are important for the non-profit sector but not included in standard macroeconomic measures—would have added a further $41.8 billion to the economy in 2013 (the most recent year of available data), representing 22.3% of non-profit GDP that year.
Real non-profit gross domestic product increases in 2017
Real GDP in the non-profit sector (the volume of economic activity) was up 1.0% in 2017, following a 1.8% increase in 2016. By comparison, real GDP for the total economy grew 3.0% in 2017.
The increase in 2017 was attributable to government non-profit institutions, which grew 1.9%. In contrast, community and business non-profit institutions declined 1.3%.
Health and education dominate the non-profit sector GDP in the non-profit sector can also be expressed by type of organization or activity. Health (41.5%) and education (30.1%) generated the lion's share of activity in the overall non-profit sector in 2017, followed by social services (9.9%), including child and family services. Excluding government non-profit institutions, business and professional associations (20.3%) accounted for the largest share of the non-profit sector. This type of activity includes the work of unions supporting their members. This was followed by social services (17.5%) and culture and recreation (14.5%).
Food for thought
Interestingly, this report does not list the religious sector. In fairness, this report is broader than charity because it includes nonprofits who are not charities like Unions..
However, in other Canadian research, religion is consistently the top charity sector in terms of fundraising revenue. Furthermore, research by Statistics Canada and Imagine Canada has shown the giving, volunteerism, and regular religious observance are correlated behaviors.
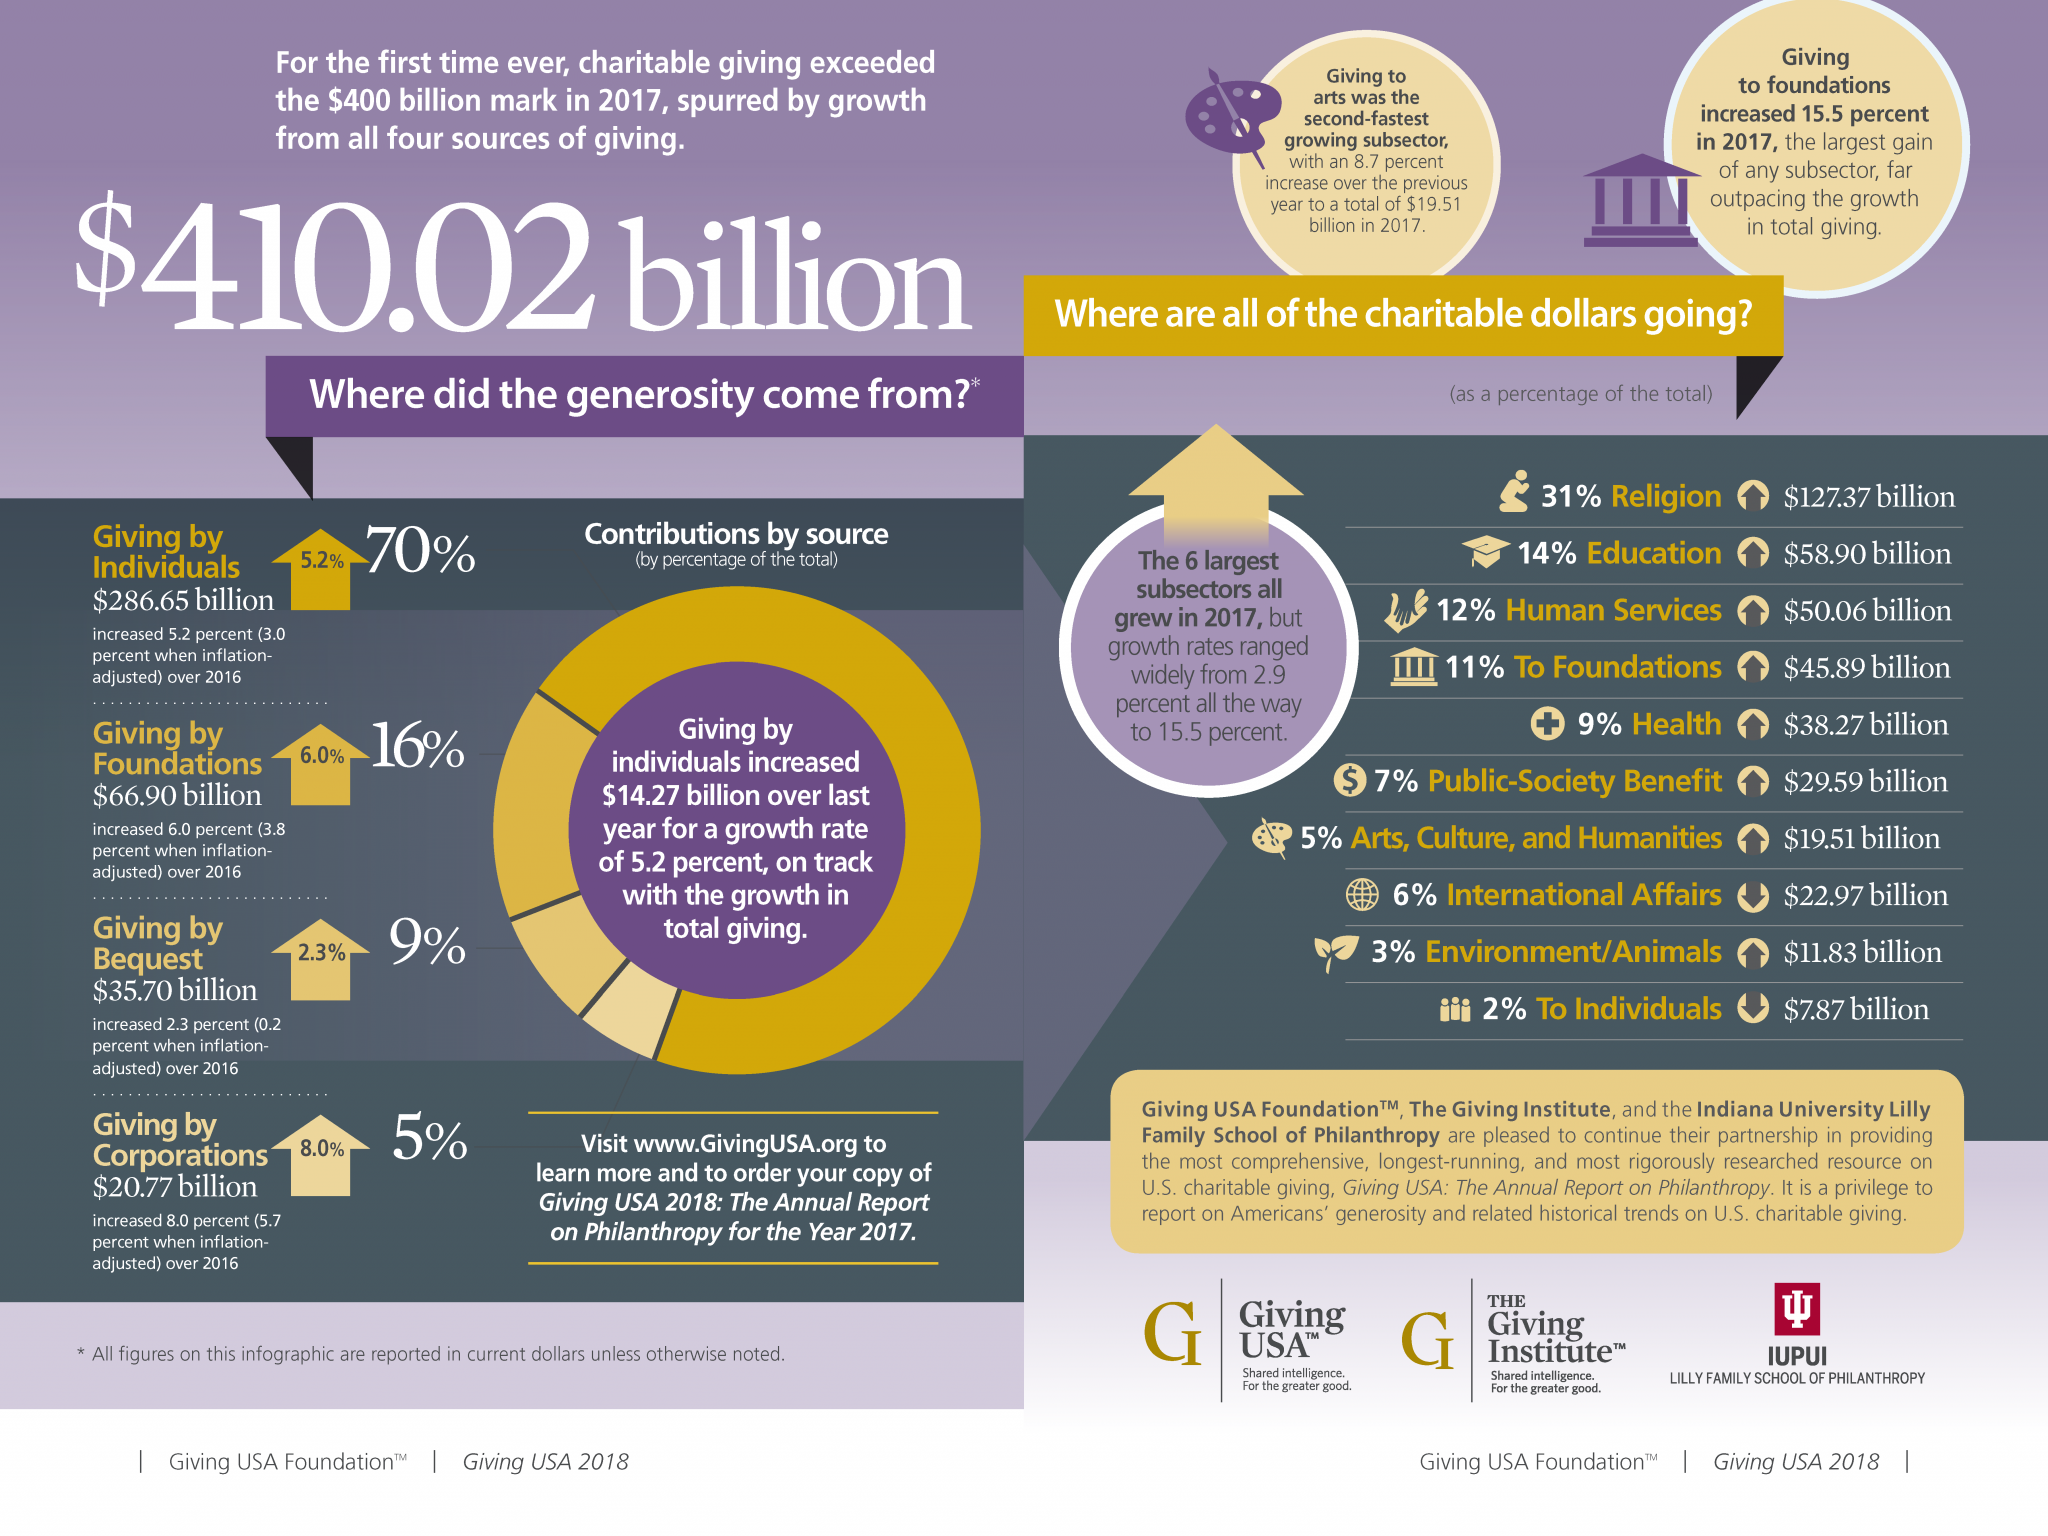
Worth noting that, according to Giving USA 2018, the top charity sectors in the US are
Religion - 31%
Education - 14%
Human services (what we call social services) -12%
Sources of income vary
Sources of income varied widely for different types of organizations in the non-profit sector.
In 2017, community non-profit institutions received nearly one-third of their income from governments (30.8%). Sales by these non-profits contributed an additional 27.8% of income while donations from households made up 17.8%. Membership fees accounted for 14.1% of income while investment income and funds provided by businesses and other institutions each contributed less than 6%.
The majority of income generated by business non-profit institutions came from sales of goods and services (61.6%), while 33.8% came from membership fees (such as condominium association fees). Other sources of income represented less than 5% of the total.
As might be expected, government non-profit institutions received most of their income in 2017 from other government organizations (72.9%), mainly provincial governments, while 21.3% was generated by the sale of goods and services. Investment income, donations and transfers from business and other institutions each accounted for less than 3% of income.
Food for thought
Governments often suggests that the charity sector turn to other, non-governmental, sources of money for income. What is sobering in this report is that membership fees, which are relevant and valuable in a condo association, may not be a real area of opportunity for many charities, particularly those working with low-income Canadians.
Interestingly, many charities, and government, believe that charitable donations will be certain way of increasing revenue. However this research suggests that it only accounts for less than 3% in the sector indicating that it is not a generally available option to all types of charities.
Employment rises in 2017
Employment in the total non-profit sector increased by 1.1% in 2017 on the strength of government (+1.9%) and business (+1.5%) non-profit institutions. Employment in community non-profit institutions (-1.0%) declined by approximately 6,000 jobs in 2017.
Average compensation per job was $57,000 in the non-profit sector in 2017. Employees in the government non-profit subsector received approximately $63,000, followed by employees in the business ($54,400) and community non-profit ($42,500) subsectors. By way of comparison, average compensation for the entire economy was approximately $59,800 in 2017.
Food for thought
Charity employees often complain that salaries in the sector are low. This research suggests that there is merit in this concern. Complicating the analysis is the fact that women are over-represented in the charity workforce. This could mean that reduced average wage in the charity sector may be influenced by the gender wage gap. According to StatsCanada, the gender wage gap in Canada is 0.87 meaning the average Canadian woman earns 87 cents for every $1 a Canadian man earns.
Share of non-profit gross domestic product varies by province and territory
The economic contribution of the non-profit sector varied by province and territory. In 2017, the non-profit sector accounted for 12.3% of the economy of Nova Scotia, well above the national average of 8.5% and the highest share of any province or territory. Similarly, the non-profit sectors in Newfoundland and Labrador, Prince Edward Island, New Brunswick, Quebec, Manitoba and the Northwest Territories all surpassed the national average.
Nunavut (4.2%) had the lowest proportion of the non-profit sector in their total economy in 2017. Ontario, Saskatchewan, Alberta, British Columbia and Yukon each had non-profit sectors smaller than the national average when expressed as a percentage of their total GDP.
Food for thought
This data raises the question about whether they way people engage in participating in society is cultural. In other words, in getting the work of a community done, do some rely more on informal ways of helping while others prefer to work more within the nonprofit structure. It would be interesting to see the rate of what Statistics Canada calls "participation" against this rate of charitable incorporation.
If included, volunteering activity would have represented over one-fifth of the sector
Volunteering, an important source of labour for the non-profit sector, is not included in standard macroeconomic measures. An estimate of economic value of this activity was derived for 2013 (the most recent year of currently available data on volunteering).
The economic value of volunteering would add an extra $41.8 billion to economic activity in 2013. This would have represented 22.3% of the non-profit sector's GDP in that year. Nearly one-quarter of the economic contribution of volunteering occurred in culture and recreation (23.7%), followed by social services (19.7%) and education and research (15.1%).
Food for thought
It is valuable to finally see the contribution of volunteers quantified. Worrisome is that trend that volunteerism has been on a slight but slow decline. While the overall number of hours has remained constant according to the most recent research (2013) by Imagine Canada and Statistics Canada, the percent of volunteers overall has been very slightly declining. While the value of volunteers is key to the sector, the downward trend is even more worrisome.
What do you think? Add your thoughts and comments below. Or write you own observation and send it to editor Ann Rosenfield at editor@hilborn.com
Ann Rosenfield is the Editor of Hilborn Charity eNews and has a secret love of data.
For a full copy of "Non-profit institutions and volunteering 2007-2017," read here.