 Editor's note: I asked data expert, Matthew Dubins of Donor Science Consulting to offer his thoughts on this recent release of charitable giving data. He also has developed a dashboard to help you explore these statistics more.
Donations by tax filers rise again
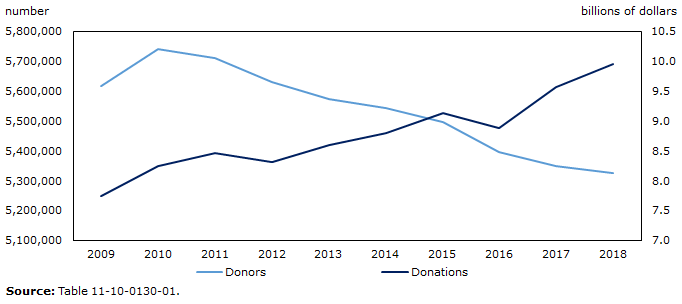
Total donations claimed on tax returns rose 3.9% in 2018 to just under $10.0 billion. While this marks a second consecutive year of increase, the growth was smaller than in 2017 (+7.7%).
In 2018, charitable donations rose most in Saskatchewan (+17.1%), following a decrease of 0.5% the previous year. Other notable increases were observed for Quebec (+5.7%) and Ontario (+5.6%). Dubins comments that Alberta was up 2.4%
Nationally, the median donation claimed by tax filers was $310 in 2018, meaning that half of these filers donated at least $310, while the other half donated less. Donors in Nunavut claimed the highest median donation ($540), while donors in Quebec claimed the lowest ($130).
Among census metropolitan areas, donors in Abbotsford–Mission (British Columbia) ($850) led the country with the highest median charitable donation for the 17th consecutive year, followed by donors in Lethbridge (Alberta) ($730).
Dubins adds "If you look at the ratio of median donation dollars to median income, it gives you a measure of how generous people in each geography were despite differences in the economy. Viewed in this way, the top 3 most generous provinces were PEI, Manitoba, and British Columbia. For every $10,000 in median income, Canadians in those provinces claimed $87.79, $82.26, and $75.37 on their tax returns."
Fewer tax filers claim charitable donations
From 2017 to 2018, the number of tax filers claiming donations declined 0.4% to 5,324,280, continuing a downward trend which began in 2011. Donor numbers were down across the country, with the exception of Ontario (+0.1%) and Quebec (0.0%). The largest decrease was observed in Nunavut (-5.5%).
Canadians with higher incomes and seniors are the most generous
Tax filers with incomes of $80,000 or more represented 35% of all donors in 2018. The relative importance of this group among donors has grown steadily since 2011, when they represented 27% of all donors.
Seniors aged 65 and older make up an important and growing share of tax filers that report donations. Since 2010, when looking at the age of tax filers, seniors have been the largest donor group. Growth observed from 2010 to 2018 in the number of tax filing seniors that donate (+7 percentage points) has outpaced growth in the number of seniors among tax filers (+4 percentage points). By 2018, seniors represented 31% of all tax filing donors in Canada, an increase from 24% in 2010. The higher share of seniors among donors was observed across the country, with the exception of the Northwest Territories (15%) and Nunavut (14%). In these two territories, there is a much lower concentration of tax filers in the 65 and older age group compared with the rest of the country.
Dubins notes "For the time being, we should be thankful that our elder tax filers have shouldered an increasing burden of charitable donation in this country, despite dramatically decreased percentages of tax filers claiming any donations whatsoever. How long can this situation be sustained for? Regrettably, the precipitous decline in the percentage of tax filers claiming donation will out-pace the laudable generosity of our seniors. When that happens, the charitable sector in Canada will likely experience an even greater and longer dip in donor dollars than we saw even during the recession of 2007 to 2009."
To explore these statistics using a fun and interactive dashboard developed by Dubins for Donor Science Consulting, click here.
To reach the full StatsCanada report click here
For more information, or to enquire about the concepts, methods or data quality of this release, contact Stats Canada (toll-free 1-800-263-1136; 514-283-8300; STATCAN.infostats-infostats.STATCAN@canada.ca) or Media Relations (613-951-4636; STATCAN.mediahotline-ligneinfomedias.STATCAN@canada.ca).
Matthew Dubins is the Chief Donor Scientist at Donor Science Consulting. This isn’t just a job for Matthew. Matthew has a Bachelors in Psychology and Sociology and a Masters in Experimental Psychology. His interest in what motivates people converged with his scientific-thinking, methodology, and understanding of data and led him to work at a non-profit where he started honing his understanding and methods of applying data for the benefit of non-profits. Before launching Donor Science Consulting, Matthew worked for the Canadian Breast Cancer Foundation (now Canadian Cancer Society), KCI and Blakely and Cornerstone, where he expanded his knowledge and range of data tools. Matthew saw a need for supporting small- to mid-sized non-profits in their quest for data and realized it was time to open the doors to Donor Science Consulting.
Notes
The title of the infographic is "Trends for number of donors and total donations, Canada" This is a line chart with two different y axes. The y axis on the left represents the rising or falling number of donors. This y axis starts at 5,100,000 and goes to 5,800,000, with increments of 100,000. The y axis on the right represents the rising or falling total donations. This y axis starts at 7,000,000,000 dollars and goes to 10,500,000,000 dollars, with increments of 500,000,000 dollars. The x axis represents the year and goes from 2009 to 2018, with increments of 1. There are two series. The first series represents the change in numbers of donors. The second series represents the change in total donations.